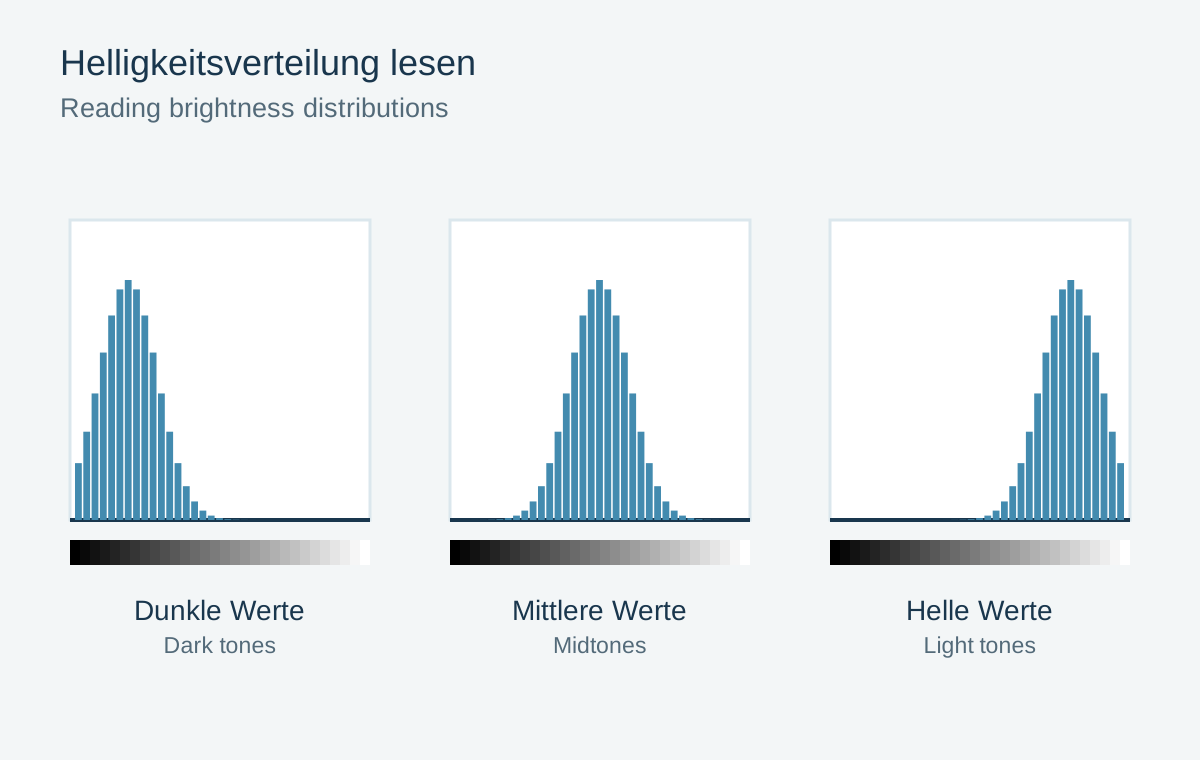
A night photograph with a large black sky can legitimately concentrate its histogram on the left. Bright snow can place most of it on the right. The graph does not need a central mountain or an even spread across both sides. It becomes useful when compared with the actual subject: which bright or dark surfaces should retain detail, and which can remain featureless?
Axes and edges
The horizontal axis runs from dark tones on the left to bright tones on the right. Height shows how many pixels fall within a tonal range. A tall narrow peak therefore initially means only that a similar brightness occurs frequently. A large uniform wall can produce it without anything being incorrectly exposed.
Concentrations against an edge deserve attention. On the right, parts of the image may reach the brightest representable value; on the left, the darkest. However, the graph does not tell you which objects are affected. Supplement it with highlight warnings or magnify the relevant area. A tiny clipped reflection on metal is a different decision from a white forehead with no skin texture.
Three subjects, three sensible distributions
A black cup on dark fabric produces many values on the left. That may describe the scene correctly. Moving everything toward the middle turns the fabric grey and changes the atmosphere. White paper on a bright table can just as reasonably produce a right-weighted distribution. The task is to retain important gradations within dark or bright surfaces, rather than push the tallest peak into the centre.
A window behind a dark houseplant may instead create two clearly separated regions. There need not be a large central peak between them. Check the photograph to identify which region belongs to which object. A histogram knows nothing about subject importance: it cannot distinguish an important bright cloud from an intentionally white luminous surface.
Change exposure by one stop for a test and watch photograph and graph together. This teaches you which surfaces approach the limits. A small clipped lamp may coexist with useful detail throughout the rest of the frame; a large white patch on a portrait forehead makes the same right edge much more problematic. The size and importance of the affected area belong in the decision.
Bright sky above a dark building
Imagine a shaded facade beneath luminous clouds. The histogram may show two clearly separated groups. Increasing exposure moves both rightward: the building becomes easier to read, but the clouds may lose detail. Reducing exposure protects the sky without automatically making the building more visible. The graph explains the conflict; it does not remove the brightness difference.
First decide which area carries the photograph. For an architectural image, another time of day or a viewpoint including less sky may work better. For a cloud study, the facade can remain dark. An exposure bracket is another possibility for a stationary scene. One histogram cannot determine which of these intentions is correct.
Colour channels and RAW previews
The brightness histogram can look harmless while, for example, the red channel of a vivid flower already reaches its limit. Check RGB histograms as well for strongly saturated subjects if your camera provides them. Losing one channel can alter subtle colour gradations before the whole area appears white.
The camera histogram normally uses the processed preview even when you save RAW. White balance, picture style and contrast can influence its shape. Treat it as guidance rather than an exact measurement of every reserve in the raw file. A neutral preview makes comparisons easier. For an important unrepeatable photograph, do not rely solely on an assumed rescue during editing.